In this blog St. Thomas E-Learning and Research (STELAR) instructional designer Matt Vernon invites you to try out a survey tool (Survey123) that he uses to support active learning.
What does active learning mean for you? For me it’s when I am so immersed in doing something that time slips away…so focused on a goal that I tackle learning something complex to accomplish it…doing something that is personally relevant…or working with others so that it’s a socially rewarding task.
What helps you to create and see signs of active learning in your teaching? What technology tools may help you to create active learning experiences? For me, ArcGIS Survey 123 is one great resource!
What is ArcGiS Survey123
ArcGIS Survey123 is a tool to collect location data and pair it with other types of data. Although designed for efficiently conducting field surveys, Survey123 also has educational and research applications ranging from simple individual or class inquiries to crowd-sourced citizen science projects. The remainder of this blog takes you through a way to experience Survey123 and resources to get you started using it.
Learn by Doing: Give ArcGIS Survey123 a Try!
I hope you find this fun! Below is an activity to investigate the relationship between our material stuff, where it was made, how important it is to us, and what might happen to it when we are done with it.
Here’s what you’ll need:
- Something you use in your work that has a label of origin or you know where it was made
- A computer, mobile phone, or tablet
- About 5 minutes of your time, maybe less
Step 1: Collect data
Begin by opening this survey123 on a computer or mobile device or Scanning the QR code below. If your device asks to access your camera, select yes if want to take a picture of your item.

Congratulations! you just participated in a…
Did you catch the Thank You Message?
If not, don’t worry, you can try again.
Step 2: View the results and analysis
Survey123 provides a fun set of analysis tools to share your data or keep it to yourself. Filter your data, interpret your results, create charts and graphs, print, share or export your results. Check out our data!
What did you discover about your material goods? Where were they made? Where might they end up when we are done with it?
What else is going on that we didn’t anticipate? What new questions can we ask?
Let me know! email me (Matt) at vern0007@stthomas.edu.
Ok that was fun, what else can we do with it?
What’s relevant to you? Social, cultural, political, historic, spiritual, architectural, engineered, business, environment, health, wellbeing, equity, infrastructure; your idea here.
One way to be active and engaged is to explore your own curiosity and explore it with others with similar interests. Collaborating with experts around topics that matter to you can help you to make a meaningful impact in the world. Through engaging in data collection and analysis you can fill in important gaps in data at finer scales, like a neighborhood, that can positively impact or inform decision making and public knowledge.
At its heart ArcGIS Survey123 is about adding all sorts of information to a location.
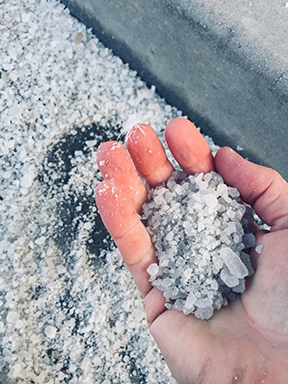
Image of a handful of road salt on a sidewalk
I sample excess sidewalk salt in my neighborhood. When I encounter it I use a survey on my phone to take a picture and choose from a range of values such as: Small Residual, Medium Residual or High Residual. My phone records location, time and date for me.
Taking a photo helps me validate my choice of values, gives me more context about the location, and provides visual evidence for me to engage stakeholders in increasing awareness of chloride pollution.
Makes collecting data easier so you spend more time doing the fun stuff.
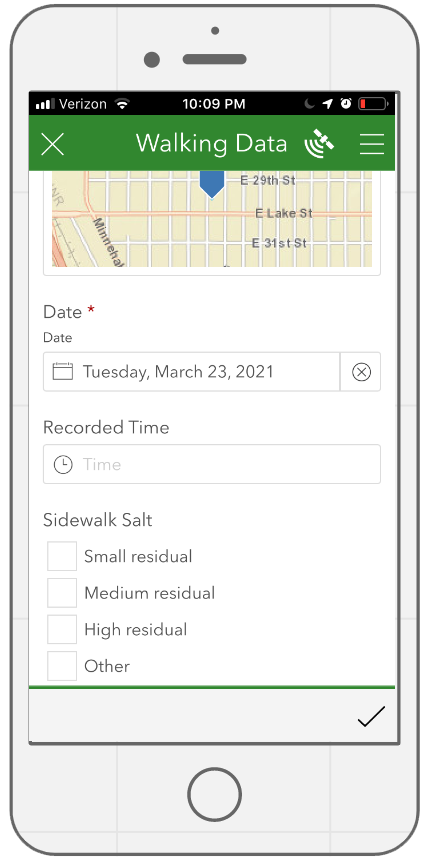
Survey to sample excess sidewalk salt
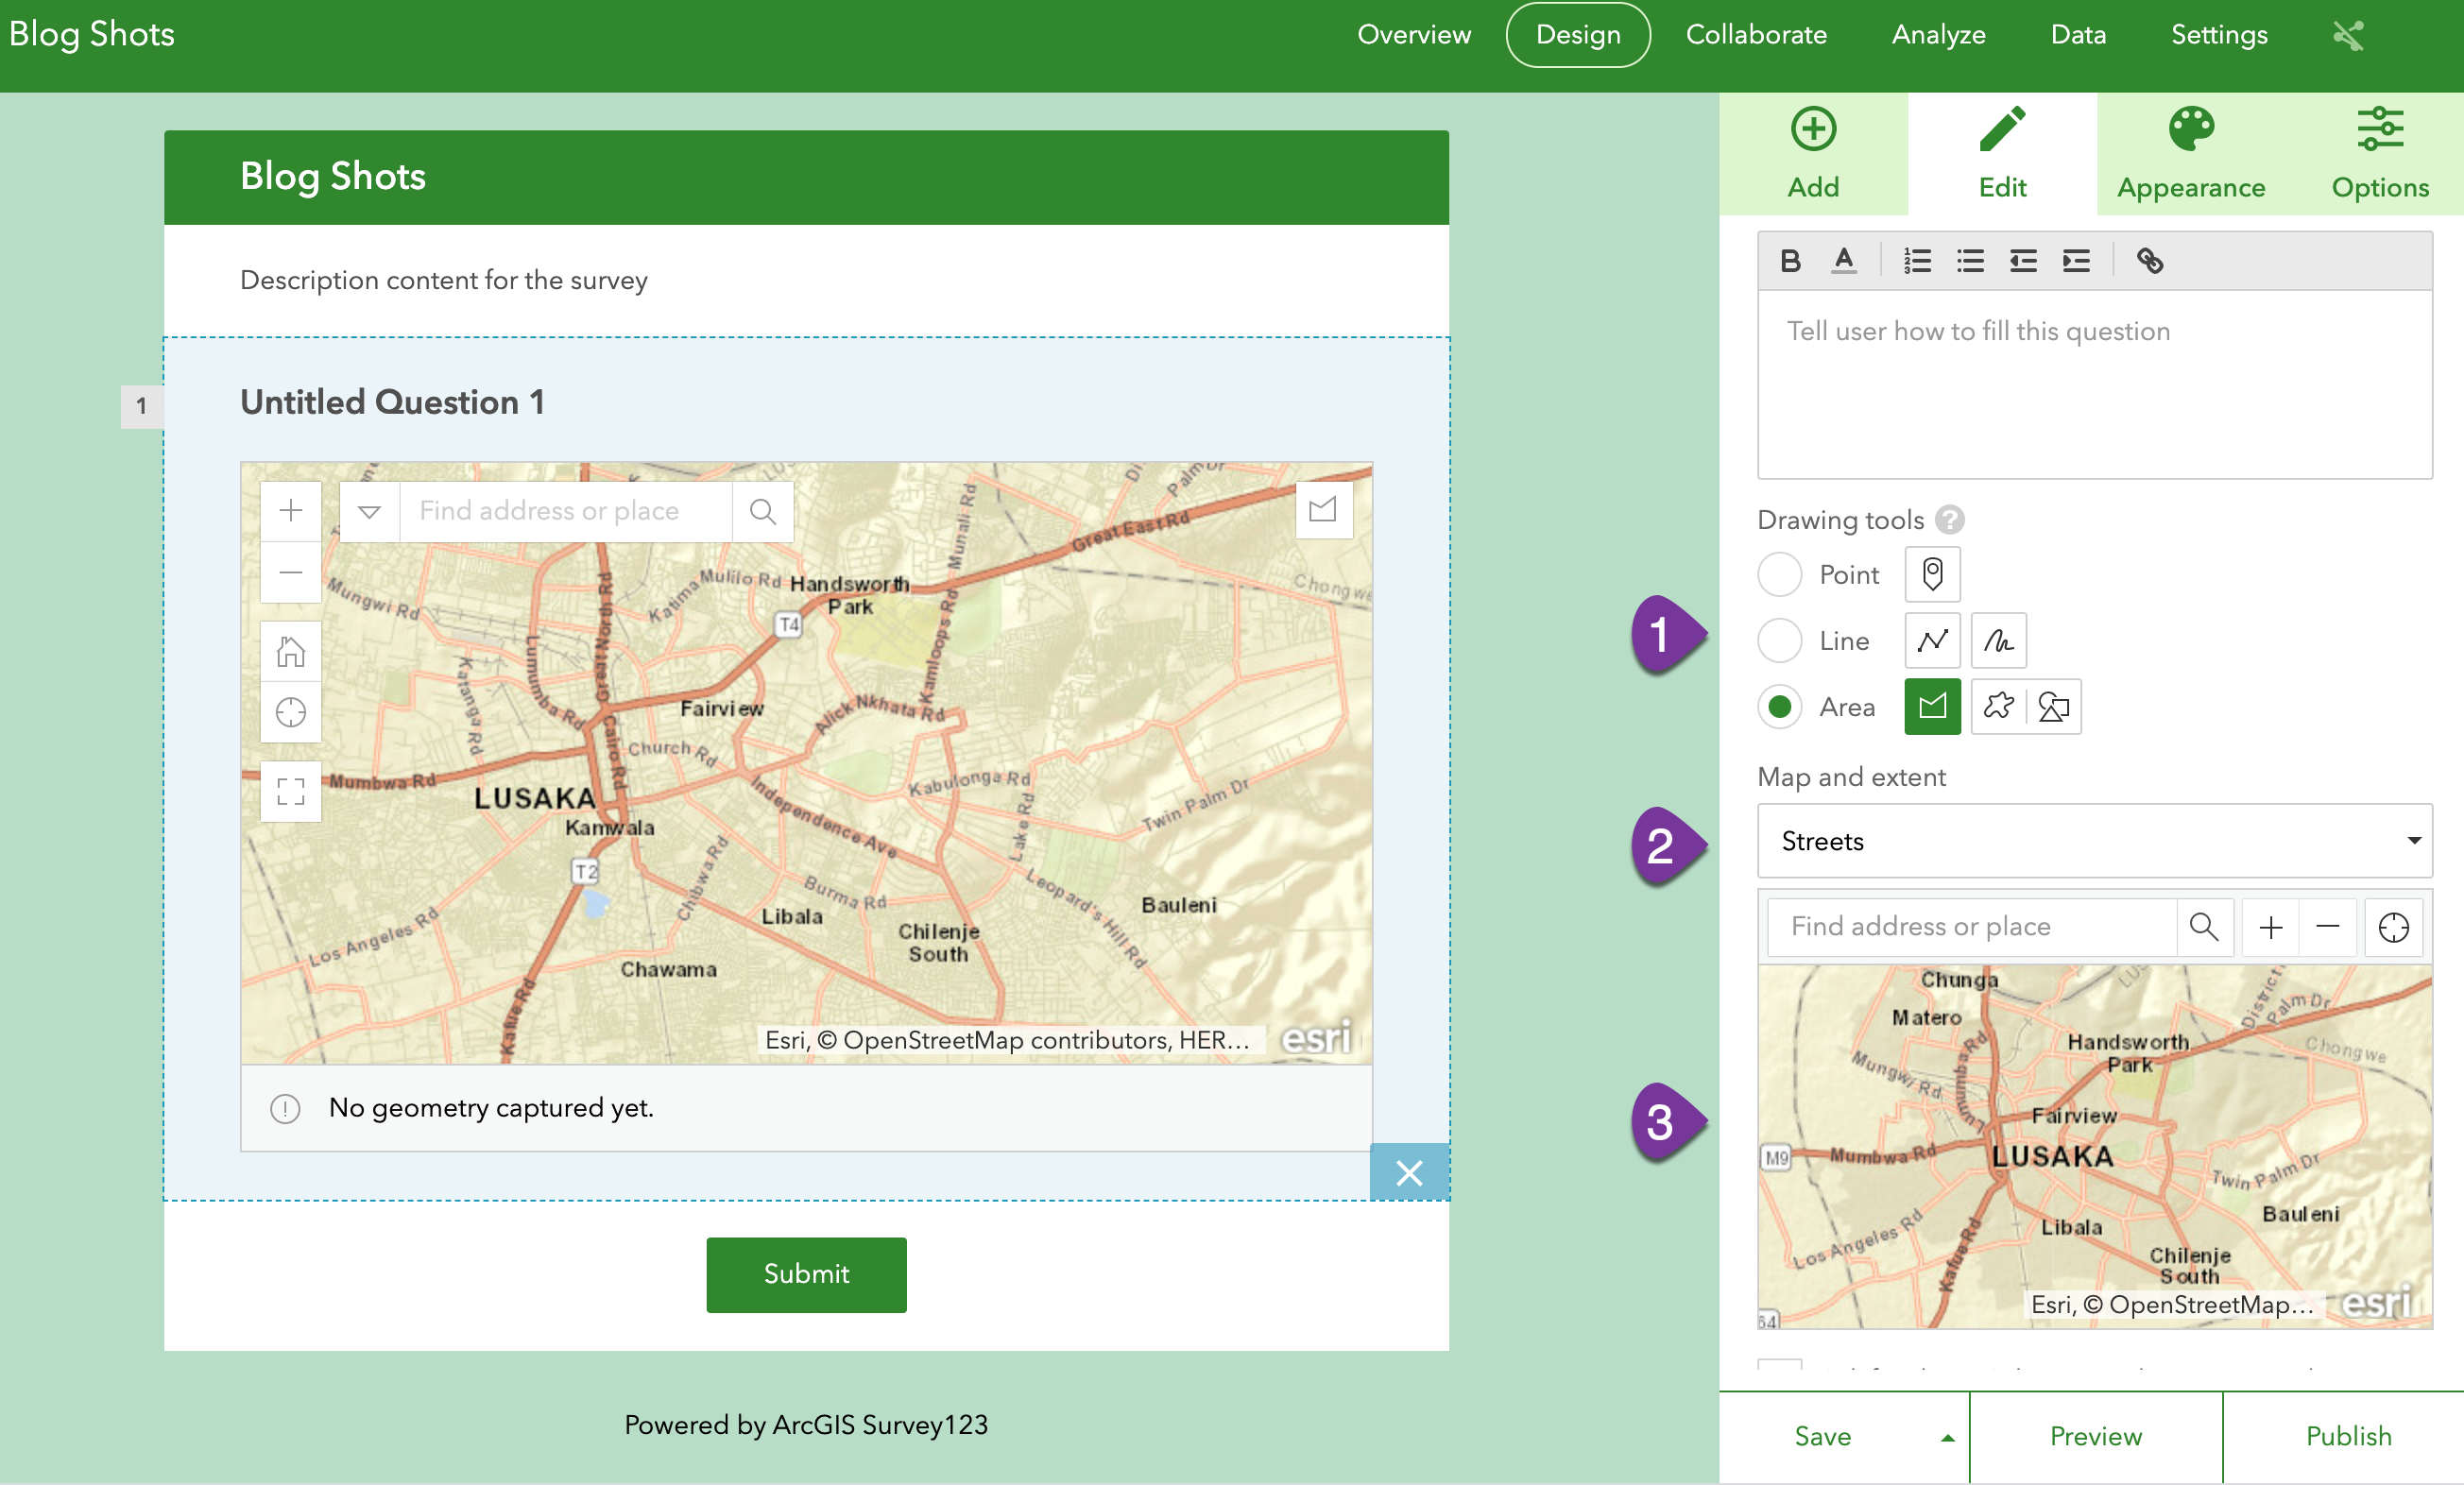
Survey123 has a wide selection of question types you can use to crowdsource or individually collect data. The most valuable question type is the map which can capture points, areas, or lines; like a walking path.
A smartphone can sense light (in photos and video), sound, speed, direction, altitude, longitude, latitude, and more. With the mobile app, you can collect data on or offline. Your phone’s sensors can add a lot of information for you, so you can spend more time exploring and observing, or quickly take a sample when you are out and about or on the move. What do you notice? What’s going on? What else? This too is active learning.
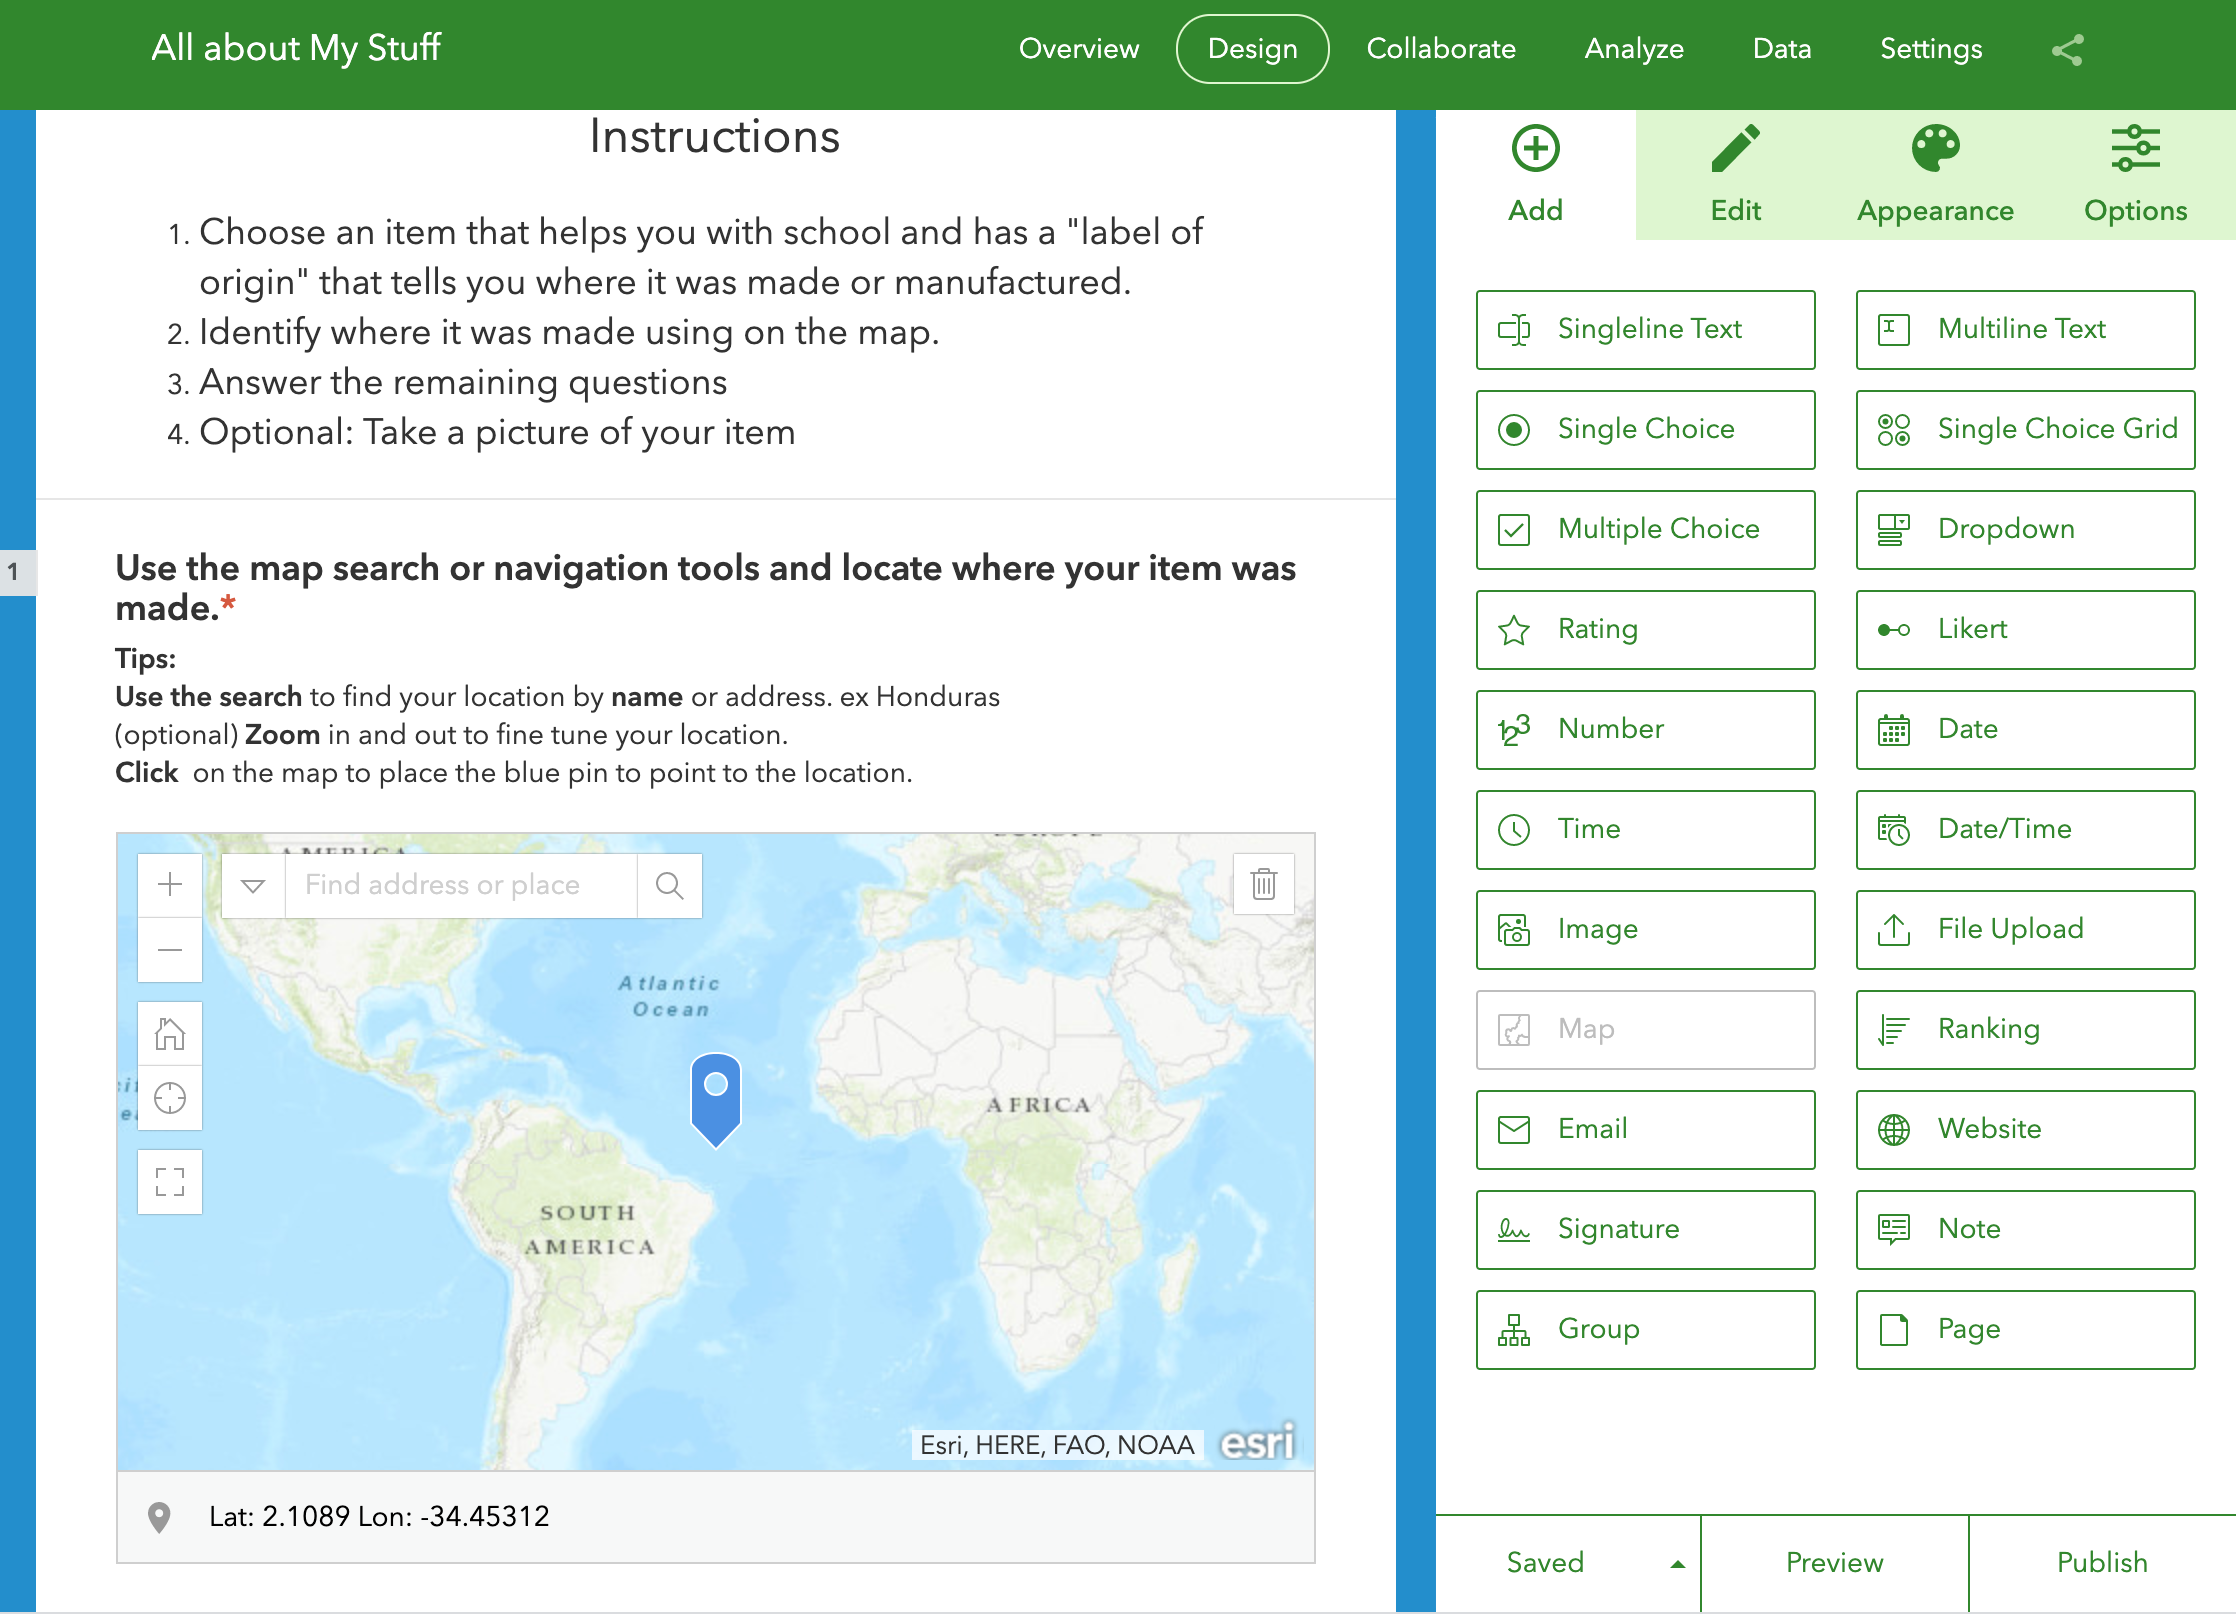
The image gallery below are pictures of the types of questions you can use and more ways to dig in to the data for the locations you sample.
-
-
Image showing all survey123 question types to build a survey from
-
-
Image showing the survey123 map question type
-
-
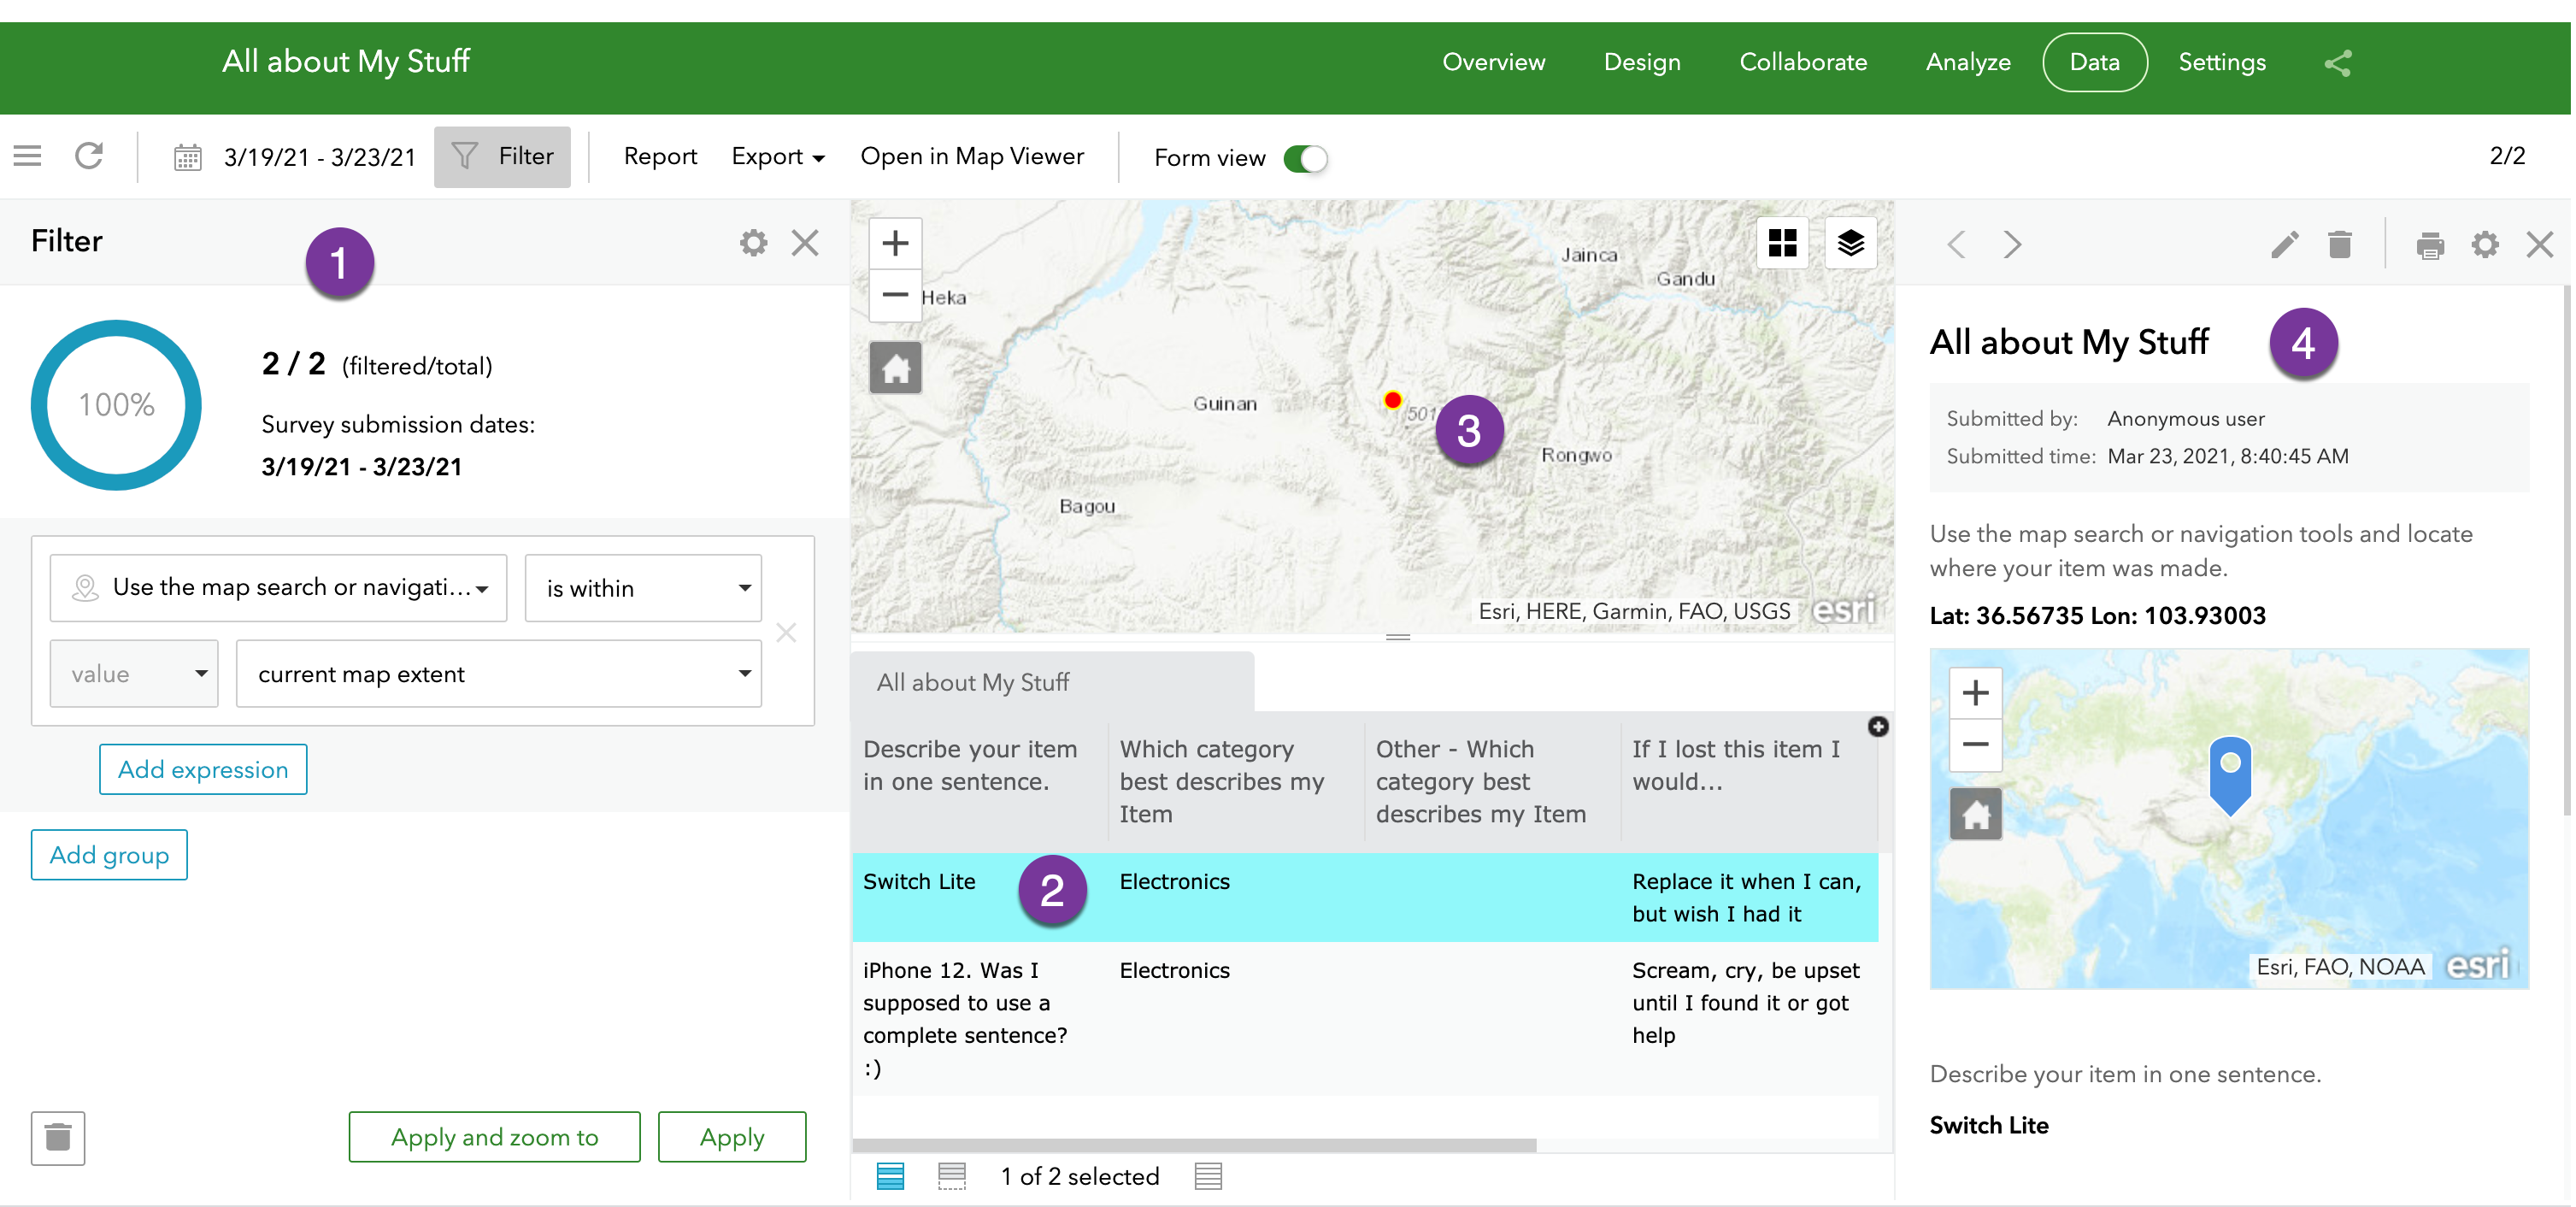
Map showing data analysis features of Survey123
Mapping it! Let’s look at data on a map!
Here is our stuff represented on a pretty simple map. This map has 4 layers of information:
- A base map or canvas to layer stuff on top of
- A layer with the locations of our stuff combined with one of our questions; the intensity of our response if we lost it
- A layer representing the Human Development index score for 2013 by country
- A Layer with human population estimates by country
Tip: Click on the locations to display the results of all the questions we asked for that record
*Layers 3 & 4 and much more are available on the ESRI Living atlas
Communicate it
StoryMaps are great platforms to communicate about data and create compelling stories to showcase your results and draw attention to your crowdsourcing, placemaking and citizen science projects.
If you are interested in using ArcGIS Survey123 to make maps or StoryMaps , contact STELAR to discuss your ideas and we can help you get started. The University of St. Thomas’ Geography Department graciously manages our ERSI account with ArcGIS Survey123 and other tools.
This post was written by Matthew Vernon, Instructional Designer (vern0007@stthomas.edu) with the St. Thomas E-Learning and Research (STELAR) Center at the University of St. Thomas in St. Paul, Minn. To learn more about STELAR, please visit our website at www.stthomas.edu/stelar or email us at stelar@stthomas.edu. Continue Reading