April – 2019 – St. Thomas E-Learning And Research
Monthly Archives

April 2019

Paleofuturism

“Just double-click on the seagull…”

One interesting (“interesting” meaning a mix of “humorous,” “encouraging,” and “demoralizing”) aspect of paleofuturism is finding decades-old technologies that were called “obsolete”…yet are still alive and well today.

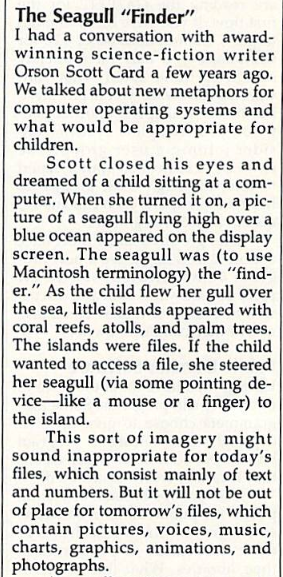
In January 1987, Fred D’Ignazio wrote that “The desktop metaphor came from computer designers’ image of computers as business tools, as information processors. We process information at desks, they reasoned, so why not make a computer simulate a desktop? The computer as desktop is a valid, viable image. But it’s only one image. It’s time for us to search out new images that relate more to our senses, feelings, and imaginations.”

This sounds like a great idea… but how much progress has been made in 30 years?  (Hint: very little.)  Does that lack of progress toward an alternate metaphor mean that humans are unable to escape the confines of an image that was established for us decades ago?  Or have we arrived at the best metaphor there is and that’s why we stick with it?

D’Ignazio gave an example of the kind of alternatives he was envisioning at the time:

The Seagull "Finder" - I had a conversation with award-winning science fiction writer Orson Scott Card a few years ago. We talked about new metaphors for computer operating systems and what would be appropriate for children. Scott closed his eyes and dreamed of a child sitting at a computer. When she turned it on, a picture of a seagull flying high over a blue ocean appeared on the display screen. The seagull was (to use Macintosh terminology) the "finder." As the child flew her gull over the sea, little islands appeared with coral reefs, atolls, and palm trees. The islands were files. If the child wanted to acess a file, she steered her seagull (via some pointing device-like a mouse or a finder) to the island. This sort of imagery might sound inappropriate for today's files, which consist mainly of text and numbers. But it will not be out of place for tomorrow's files, which contain pictures, voices, music, charts, graphics, animations, and photographs.

We’re definitely living in the world of “tomorrow’s files” yet we still seem bound to a virtual desktop.  Some VR environments are starting to approach this alternate vision: when you don an Oculus Go headset, you find yourself on a beach, surrounded by floating screens that you click.  Your phone or iPad doesn’t have a “desktop” but a… “home screen,” perhaps?

Those alternatives are a far cry from a flying seagull.

A dozen years ago, “Second Life” helped connect people to one another and flying (seagull-like) was a mode of transportation from one area to another… but it was much less efficient than simply typing in coordinates to a very DOS-like box.  But Second Life itself is another example of a technology and “computing environment” that died (no pun intended).

Are we stuck on the desktop forever?

This post was written by Eric M. Larson, an Instructional Systems Consultant in the St. Thomas E-Learning and Research (STELAR) Center at the University of St. Thomas in St. Paul, Minn., from his very typical desk on a computer with a very traditional desktop. See it in person down at STELAR in the lower level of the OSF Library, where you’ll find yourself among friends. You can also email us at stelar@stthomas.edu.

Technology Tools

Qualtrics: Beyond Simple Surveys

When most people hear about Qualtrics, they immediately think of standard surveys: fill-in-the-blank questions, multiple-choice questions, perhaps long-form essay/response questions. You know, basic survey stuff – and that’s to be expected! Qualtrics was born out of a desire to serve the needs of academic research: data collection and analysis. The purpose of this series is to take you beyond those basic survey features and explore some of the unique and powerful uses of the Qualtrics platform. During the course of this series, we will demonstrate features such as branches, variables, scoring, authentication, actions, data reporting and analytics, and much more.

Branching

One of the most powerful features of Qualtrics is its ability to introduce branching logic. Branches allow the project designer to tailor the respondent experience based on various aspects. For instance, an answer to a specific question might lead the respondent to a whole series of questions that are not presented to others who did not select that answer. Branches also allow projects to do special math operations, create variables to be used in other parts of the project, and customize feedback or end-of-survey experiences, just to name a few. Branches come in two forms. The simplest form is called display logic, which is when you tell an individual question “Display this question ONLY if these criteria are met.” That criteria could be a specific choice selected in another question or a combination of choices selected (or not selected) in a range of questions.

The more powerful form of branching is represented in the Survey Flow, where you define the flow or experience of a respondent as they move through question blocks. Utilizing this form of branching, you are able to create wholly customized, often personalized, experiences through the project.

One example of the use of branching is a “choose-your-own-adventure” project. In this example, the participant is trying to find the quickest route from New York to Sydney based on various criteria (jobs, items, choices, etc). There is a random element introduced at the beginning where the participant is assigned a role that includes specific items to be carried along with them. This project uses branches extensively to define what is presented to the participant based on the choices they make throughout. In some cases, the path leads them all the way to London. In other cases, they are stranded and their voyage fails.

Screen recording of Incredible Race example

Our second example is a part of capturing data variables (which Qualtrics refers to as Embedded Data) for use elsewhere in the project. In this example, participants were asked to rate their institutional plans for exploring changes to various parts of their IT infrastructure and the timeline for those evaluations. Branches were used to capture those pieces of data to be used at the very end of the project where their individual institutional timeline is presented utilizing a Javascript timeline library (a feature we will discuss in a future article)

Screen recording of the Timeline example

Our final branching example comes from a self-assessment project. Students were asked to rate their relative comfort with various technologies and other personal learning skills. Based on their responses, branching was leveraged to provide feedback and suggest further reading, to both help students sift through a large amount of training material as well as provide a more personalized user experience.

Screen recording of the self-assessment example

Branching is a very powerful tool that serves as the basis for other advanced features. In our next article, we will discuss how Branches and variables, which Qualtrics refers to as Embedded Data, can be used to build even more personalized and innovative experiences.